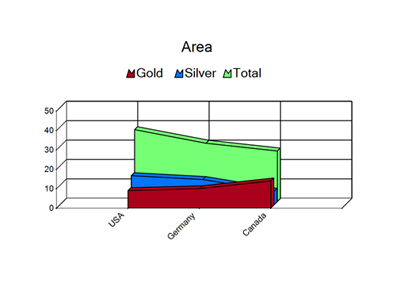
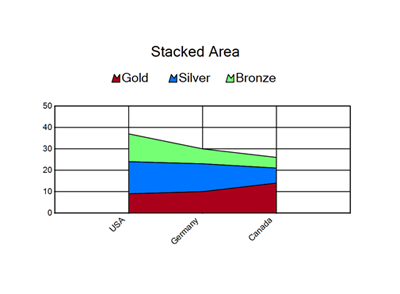
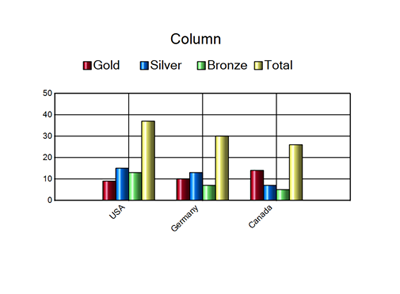
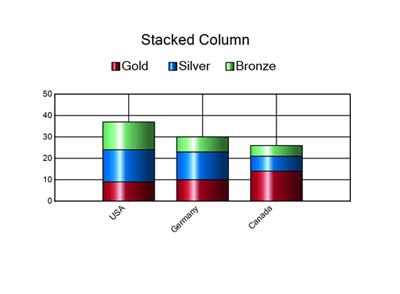
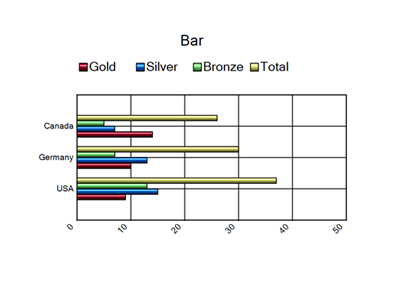
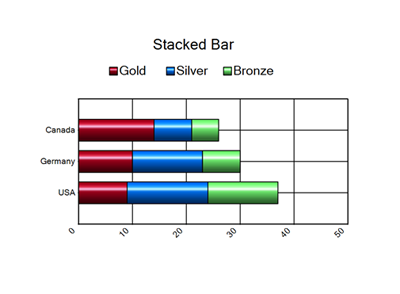
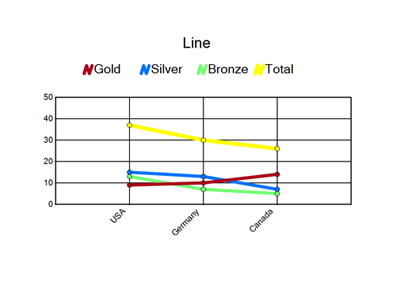
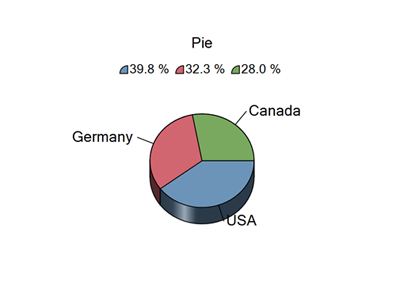
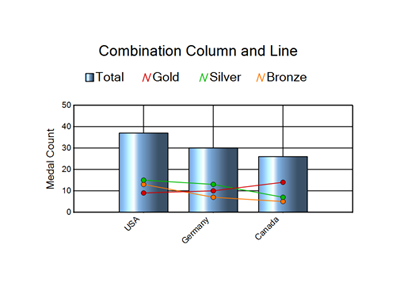
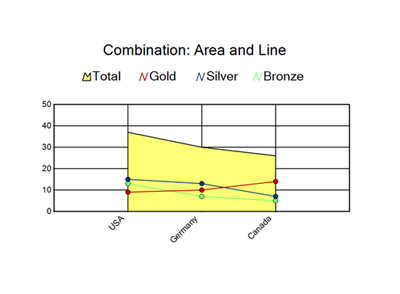
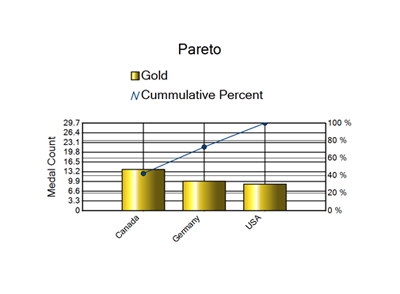
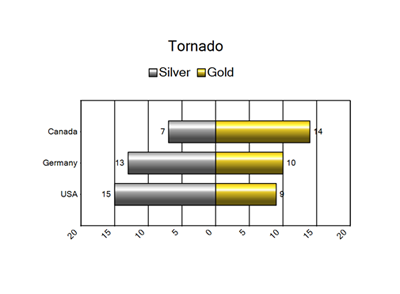
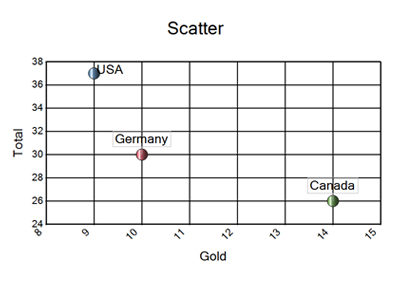
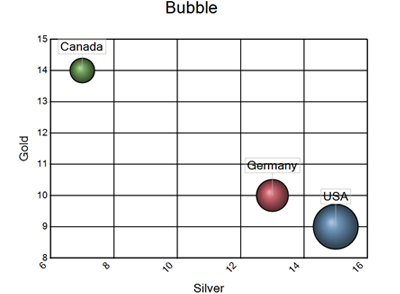
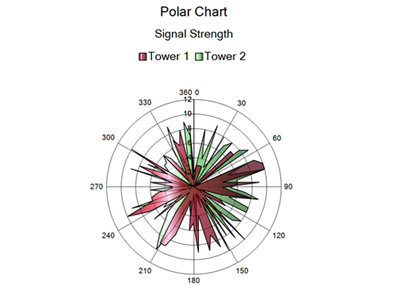
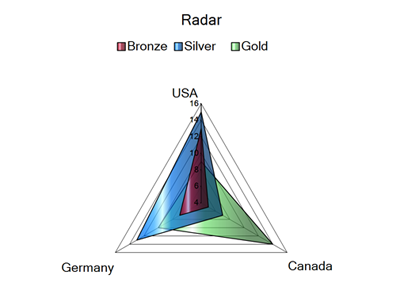
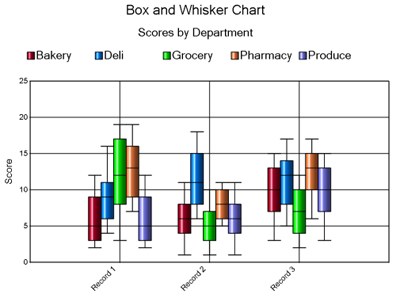
2023.1Designerツールレポーティンググラフ作成ツールグラフのタイプグラフのタイプ以下の画像は、グラフ作成ツールで設定できるグラフのタイプを示しています。面積層エリア列積層列棒積層棒グラフ折れ線円縦棒と折れ線の組み合わせ面と折れ線の組み合わせパレートトルネード散布図バブル極座標グラフレーダー箱ひげ図