Tipos de gráfico
As imagens a seguir mostram os tipos de gráficos que a ferramenta Geração de Gráficos pode configurar.
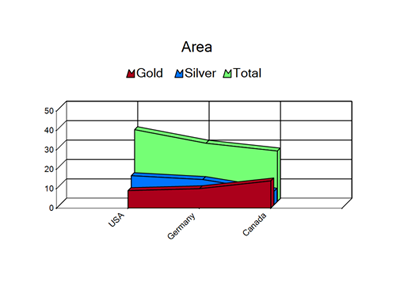
Área
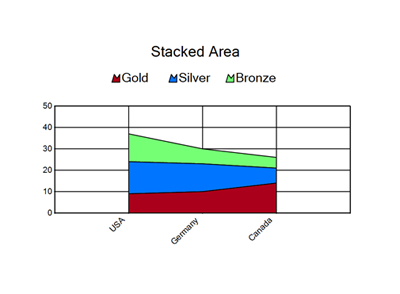
Área empilhada
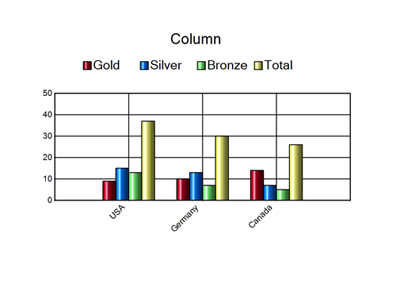
Coluna
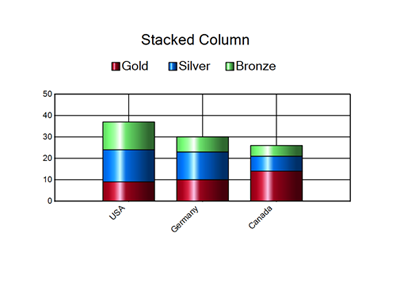
Coluna empilhada
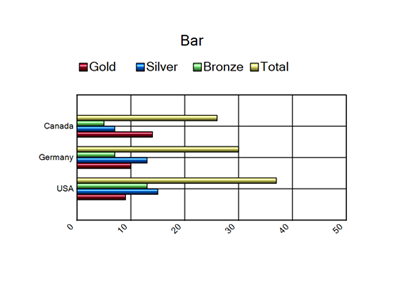
Barra
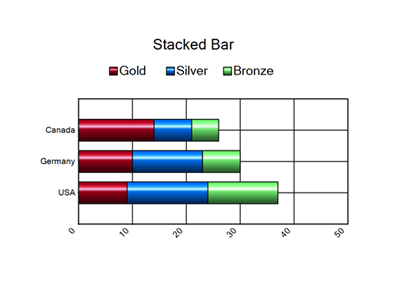
Barras empilhadas
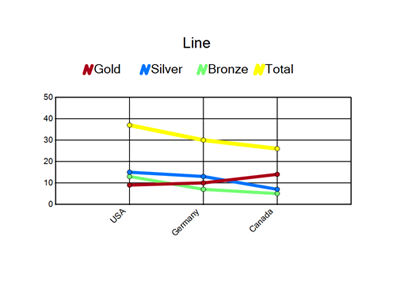
Linha
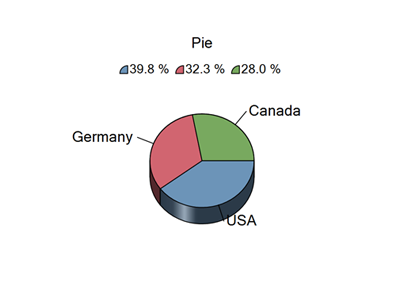
Pizza
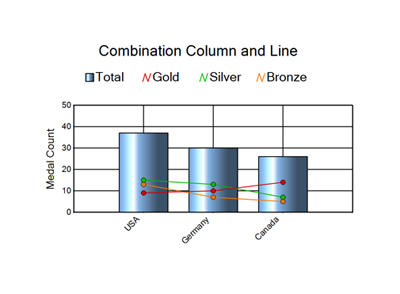
Combinação de coluna e linha
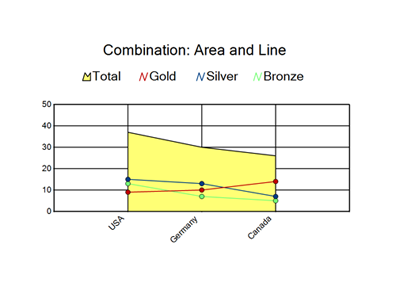
Combinação de área e linha
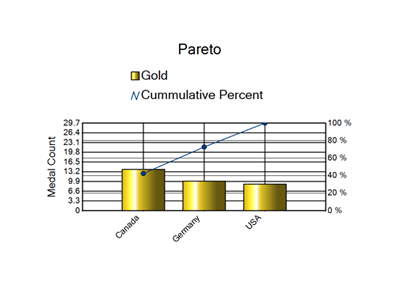
Pareto
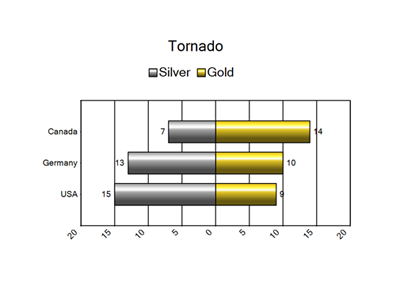
Tornado
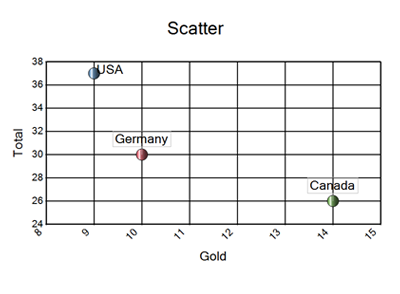
Dispersão
Bolha
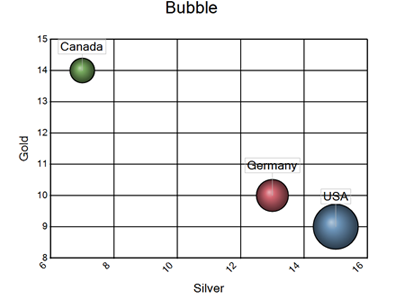
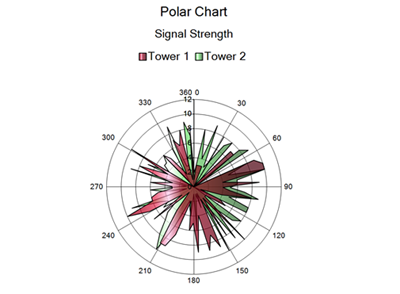
Gráfico polar
Radar
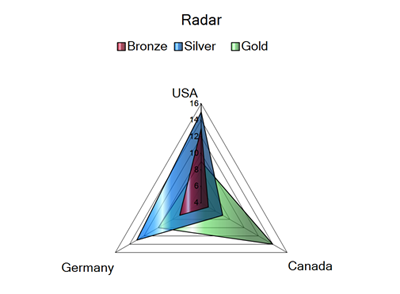
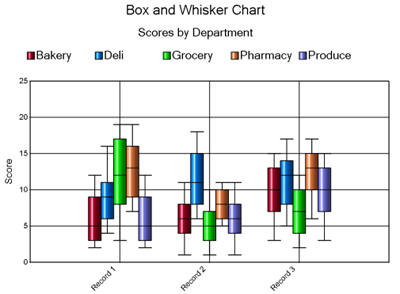
Gráfico de caixa e whisker