Transform Basics
When you edit your dataset's recipe, the Transformer page is opened, where you begin your wrangling tasks on a sample of the dataset. Through this interface, you build your transformation recipe and see the results in real-time as applied to the sample. When you are satisfied with what you see, you can execute a job against the entire dataset.
Goal
Your data transformation is complete when you have done the following:
Cleansed your data of invalid, missing, or inaccurate values
Enhanced your dataset as needed with data from other datasets
Modified your dataset to constrain its values to meet the target schema
Executed job against the entire dataset
Exported the results from your dataset and recipe for use in downstream systems
Tip
Before you begin transforming, you should know the target schema that your transformed data must match. A schema is the set of columns and their data types, which define the constraints of your dataset.
Tip
If you want to match up against the target schema, you can import a dataset to serve as the target schema to which you are mapping. For more information on this advanced feature, see Overview of RapidTarget.
Recommended Methods for Building Recipes
Designer Cloud Powered by Trifacta Enterprise Edition supports the following methods for building recipes. These methods are listed in order of ease of use:
Select something. When you select elements of data in the Transformer page, you are prompted with a set of suggestions for steps that you can take on the selection or patterns matching the selection. You can select columns or one or more values within columns.
Tip
The easiest method for building recipes is to select items in the application. Over time, the application learns from your selections and prompts you with suggestions based on your previous use. For more information, see Overview of Predictive Transformation.
Toolbar and column menus: In the Transformer page, you can access pre-configured transformations through the Transformer toolbar or through the column context menus.
Tip
Use the toolbar for global transformations across your dataset and the column menu for transformations on one or more selected columns.
When a toolbar item is selected, the Transform Builder is pre-populated with settings and values to get you started. As needed you can modify the step to meet your needs. For more information, see Transformer Toolbar.
The column menu contains the most common transformations for individual or multiple columns. Often, no additional configuration is required. For more information, see Column Menus.
Select multiple columns. Continue selecting columns to be prompted with a different set of suggestions applicable to all of them.
Search and browse for transformations. Using the Search panel and the Transform Builder, you can rapidly assemble recipe steps through a simple, menu-driven interface. When you choose to add a step, you search for your preferred transformation in the Search panel. When one is selected, the transformation is pre-populated in the Transform Builder for you. See Search Panel.
Tip
Use the Transform Builder for performing modifications to the transformation you selected from the Search panel or a suggestion card. See Transform Builder.
Sample
Loading very large datasets in Designer Cloud Powered by Trifacta Enterprise Edition can overload your browser or otherwise impact performance, so the application is designed to work on a sample of data. After you have finished your recipe working on a sample, you execute the recipe across the entire dataset.
The default sample is the first set of rows of source data in the dataset, the number of which is determined by the platform. For smaller datasets, the entire dataset can be used as your sample. In the Transformer page, it's listed as Full Data in the upper-left corner.
In some cases, the default sample might be inadequate or of the wrong type. To generate a new sample, click the name of the sample in the upper-left corner.
Note
Collecting new samples requires system resources and storage. In some environments, collecting samples incurs monetary cost.
Tip
You should consider collecting a new sample if you have included a step to change the number of rows in your dataset or have otherwise permanently modified data (keep, delete, lookup, join, or pivot operations). If you subsequently remove the step that made the modification, the generated sample is no longer valid and is removed. This process limits unnecessary growth in data samples.
On the right side of the screen, you can launch a new sampling job on your dataset. For more information, see Samples Panel.
Cleanse
Data cleansing tasks address issues in data quality, which can be broadly categorized as follows:
Consistency. Values that describe the same thing should agree with each other. For example, numeric values should have the same precision. String values should be consistently structured to mean the same thing.
Validity. Values should be constrained to the requirements of each field's data type. For example, a DateOfSale field should be a valid date.
Reliability. Values in the same field in different records should mean the same thing. For example, the value
15in the Temperature field of two different records should not mean Centigrade in one record and Fahrenheit in the other record.
When data is initially imported, it can contain multiple columns, rows, or specific values that you don't need for your final output. Specifically, this phase can involve the following basic activities:
Remove unused columns
Address missing and mismatched data
Change data types
Improve consistency, validity, and reliability of the data
Note
An imported dataset requires about 15 rows to properly infer column data types and the row, if any, to use for column headers.
First recipe steps:
When a dataset sample is first loaded into the Transformer page, Designer Cloud Powered by Trifacta Enterprise Edition attempts to split out the unstructured data to form regular, tabular data. If your data appears to contain a header row, it can be used for the titles of the columns.
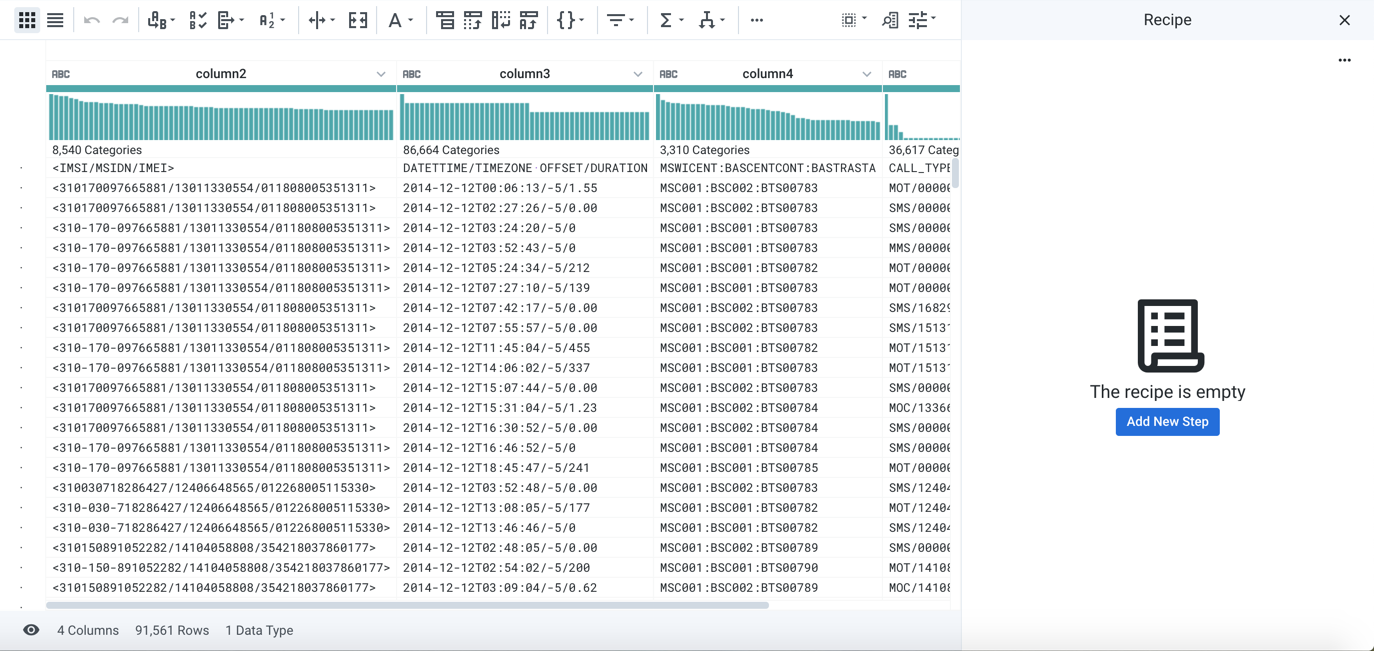
Figure: Transformer page
In the above image, some initial parsing steps have been applied to structure the data into tabular format, but these steps are not added as formal parts of the recipe. They are hidden from view in the recipe.
By default, these steps are automatically added to the recipe when you permit the application to detect the structure of the imported data.
As needed, you can enable visibility of these steps if you need to edit or remove them.
For more information, see Initial Parsing Steps.
The data resulting from these initial transforms is displayed in the data grid. See Data Grid Panel.
Your recipe is displayed in the Recipe panel on the right side. You might have to open this panel to see it. See Recipe Panel.
When you select items in the data grid, suggestion cards are displayed for you to begin building transform steps. See Selection Details Panel.
These suggestions can be modified to build more complex or subtle commands in the Transform Builder. See Transform Builder.
Don't forget to use the Transformer toolbar, which pre-configures the Transform Builder with the configuration required for a useful transformation. See Transformer Toolbar.
You can use the column context menu to apply changes to an individual column. See Column Menus.
Use a row to create headers:
In most cases, the names of your columns are inferred from the first row of the data in the dataset. If you need to specify a different row, please complete the following:
Click the Search icon in the menu bar.
In the Search panel textbox, type:
headerThe transformation is displayed in the Transform Builder. Specify the following properties:
Transformation Name
Rename columnsParameter: Option
Use row as header
Parameter: Row
1
If you need to specify a different row to use, you can specify a specific row number to use in the Row textbox.
To add this or any transform in development to your recipe, click Add. This button is disabled if the step is invalid.
Generate metadata:
On the left side of the data grid, you might notice a set of black dots. If you hover over one of these, the original row number from the source data is listed. Since the data transformation process can change the number of rows or their order, you might want to retain the original order of the rows.
Tip
Some operations, such as unions and joins, can invalidate source row number information. To capture this data into your dataset, it's best to add this transformation early in your recipe.
To retain the original row numbers in a column called, rowId, please complete the following:
Transformation Name |
|
|---|---|
Parameter: Formula type | Single row formula |
Parameter: Formula | $sourcerownumber |
Parameter: New column name | rowId |
You can use a similar transformation to generate the full path and filename to file-based sources:
Transformation Name |
|
|---|---|
Parameter: Formula type | Single row formula |
Parameter: Formula | $filepath |
Parameter: New column name | filepath |
For more information, see Insert Metadata.
Delete unused columns:
Your data might contain columns that are not of use to you, so it's in your interest to remove them to simplify the dataset. To delete a column, click the caret next to the column's title and select Delete.
Tip
If you are unsure of whether to delete the column, you can use the same caret menu to hide the column for now. Hidden columns do appear in the output.
Tip
You can also delete ranges of columns, too. See Remove Data.
Check column data types:
When a dataset is imported, Designer Cloud Powered by Trifacta Enterprise Edition attempts to identify the data type of the column from the first set of rows in the column. At times, however, type inference can be incorrect.
Tip
Before you start performing transformations on your data based on mismatched values, you should check the data type for these columns to ensure that they are correct. For more information, see Supported Data Types.
For more information, see Change Column Data Type.
Display only columns of interest:
You can choose which columns you want to display in the data grid, which can be useful to narrow your focus to problematic areas.
In the Status bar at the bottom of the screen, click the Eye icon.
For more information, see Visible Columns Panel.
Review data quality:
After you have removed unused data, you can examine the quality of data within each column just below the column title.
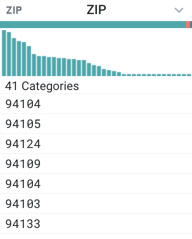 |
Figure: Column header with data quality bar
The horizontal bar, known, as the data quality bar, identifies the quality of the data in the column by the following colors:
Color | Description |
|---|---|
green | These values are valid for the column data type. |
red | These values do not match those of the column type. |
gray | There are no values for the column in these rows. |
Tip
When you select values in the data quality bar, those values are highlighted in the sample rows, and suggestions are displayed at the bottom of the screen in the suggestion cards to address the selected rows.
For more information, see Data Quality Bars.
Suggestion Cards:
Based on your selections and its knowledge of common data patterns, Designer Cloud Powered by Trifacta Enterprise Edition prompts you with suggested transformations. You can then select pre-configured transformations in the right panel of the Transformer page to quickly add steps.
Tip
Where possible, you should try to create your transforms by selecting data and then selecting the appropriate suggestion card. In some cases, you might need to modify the details of the recipe.
In the following example, the missing values in the SUBSCRIBER_AGE column have been selected, and a set of suggestion cards is displayed.
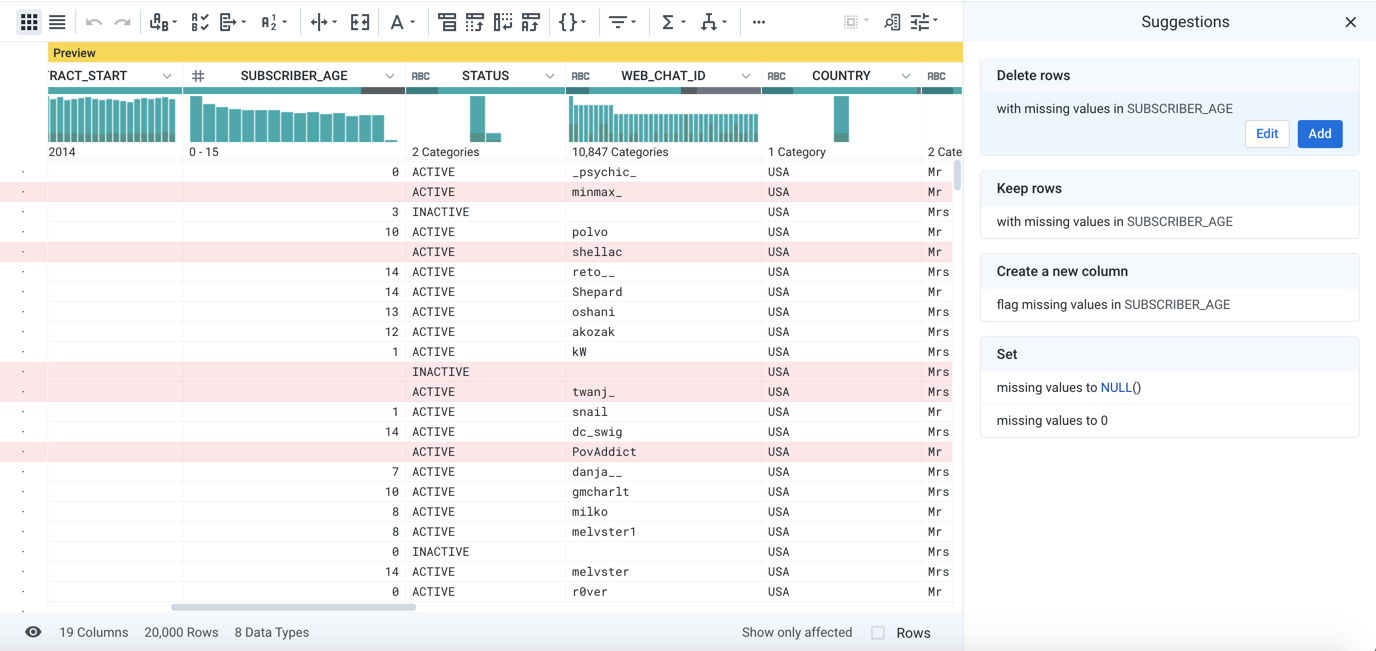
Figure: Selecting missing values
Tip
When previewing a recipe step, you can use the checkboxes in the status bar to display only affected rows, columns, or both, which helps you to assess the effects of your step.
Depending on the nature of the data, you might want to keep, delete, or modify the values. Since the data is missing, the Delete card has been selected.
To accept this suggest, click Add.
You can modify the step if needed. An example is provided later.
For more information, see Explore Suggestions.
For more background information, see Overview of Predictive Transformation.
Change data types:
If a column contains a high concentration of mismatched data (red), the column might have been identified as the wrong data type. For example, your dataset includes internal identifiers that are primarily numeric data (e.g. 10000022) but have occasional alphabetical characters in some values (e.g. 1000002A). The column for this data might be typed for integer values, when it should be treated as string values. For more information on the available types, see Supported Data Types.
Tip
Where possible, you should set the data type for each column to the appropriate type. Designer Cloud Powered by Trifacta Enterprise Edition does maintain statistical information and enable some transformation steps based upon data type. See Column Statistics Reference.
To change a column's data type, click the icon to the left of the column title.
Select the new data type.
Review the mismatched values for the column to verify that their count has dropped.
For more information, see Change Column Data Type.
Explore column details:
As needed, you can explore details about the column's data, including statistical information such as outliers.
From the caret drop-down next to a column name, select Column Details. See Column Details Panel.
For more information on column stats, see Column Statistics Reference.
Review histograms:
Just below a column's data quality bar, you can review a histogram of the values found in the column. In the following example, the data histogram on the left applies to the ZIP column, while the one on the right applies the WEB_CHAT_ID column.
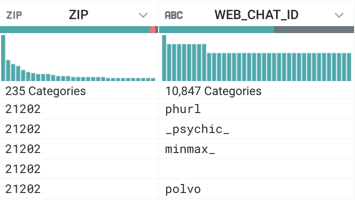 |
Figure: Column data histogram
When you mouse over the categories in the histogram, you can see the corresponding value, the count of instances in the sample's column, and the percentage of affected rows. In the left one, the bar with the greatest number of instances has been selected; the value 21202 occurs 506 times (21.28%) in the dataset. On the right, the darker shading indicates how rows with ZIP=21202 map to values in the WEB_CHAT_ID column.
Tip
Similar to the data quality bar, you can click values in a data histogram to highlight the affected rows and to trigger a set of suggestions. In this manner, you can use the same data quality tools to apply even more fine-grained changes to individual values in a column.
For a list of common tasks to cleanse your data, see Cleanse Tasks.
Modify
After you have performed initial cleansing of your data, you might need to perform modifications to the data to properly format it for the target system, specify the appropriate level of aggregation, or perform some other modification.
Tip
Modification steps are often specific to the downstream use-case for the data. If your source dataset needs to satisfy multiple downstream uses, you might need to make modifications to satisfy each use case, which are in conflict with each other. It might be easier to cleanse first, create a reference for the recipe object, and then import the reference dataset in each flow for further modification. For more information, see Flow View Page.
In the following example, the improperly capitalized word BALTIMORE has been selected, so that you can change it to its propercase spelling (Baltimore). Those rows are highlighted in the row data, and a set of suggestions for how to fix has been provided in the cards at the bottom of the screen. See Selection Details Panel.
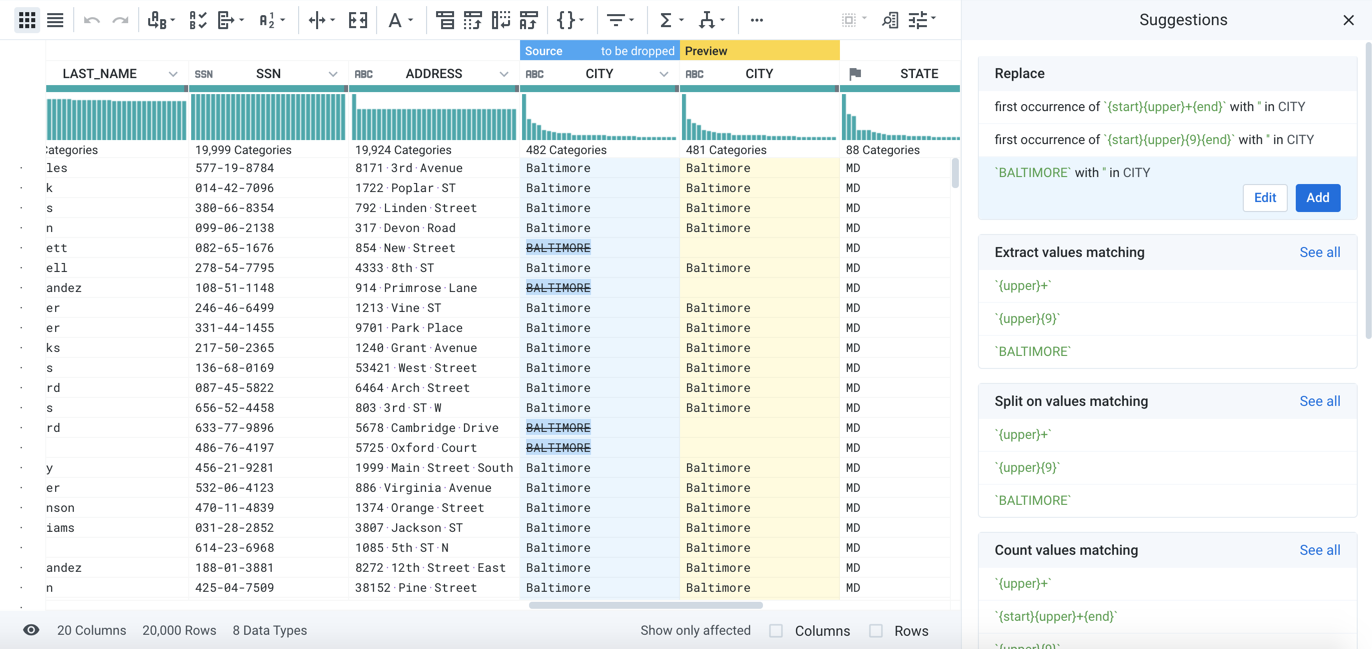
Figure: Selecting values to modify
Depending on the nature of your data, you might want to keep or change the values, or you can remove the problematic rows altogether.
Tip
When you select one of the suggestion cards, the implied changes are previewed in the Transformer page, so you can see the effects of the change. This previewing capability enables you to review and tweak your changes before they are formally applied. You can always remove a transform step if it is incorrect or even re-run the recipe to generate a corrected set of results, since source data is unchanged. For more information, see Transform Preview.
In this case, select the Replace transformation. However, there are a couple of minor issues with the provided suggestion.
Since the platform has no idea about the meaning of the selection, it might initially suggest removing the text altogether. In this case, you want to change the spelling.
In the transformation, the Find parameter value contains the pattern used to identify the selection. In this case, it is selecting all values that are capitalized. For now, you only want to fix
BALTIMORE.
So, some aspects of this transform must be changed. ClickEdit.
Transform Builder:
When you modify a transform step, you can make changes in the Transform Builder, which is a simple, menu-driven interface for modifying your transformations:
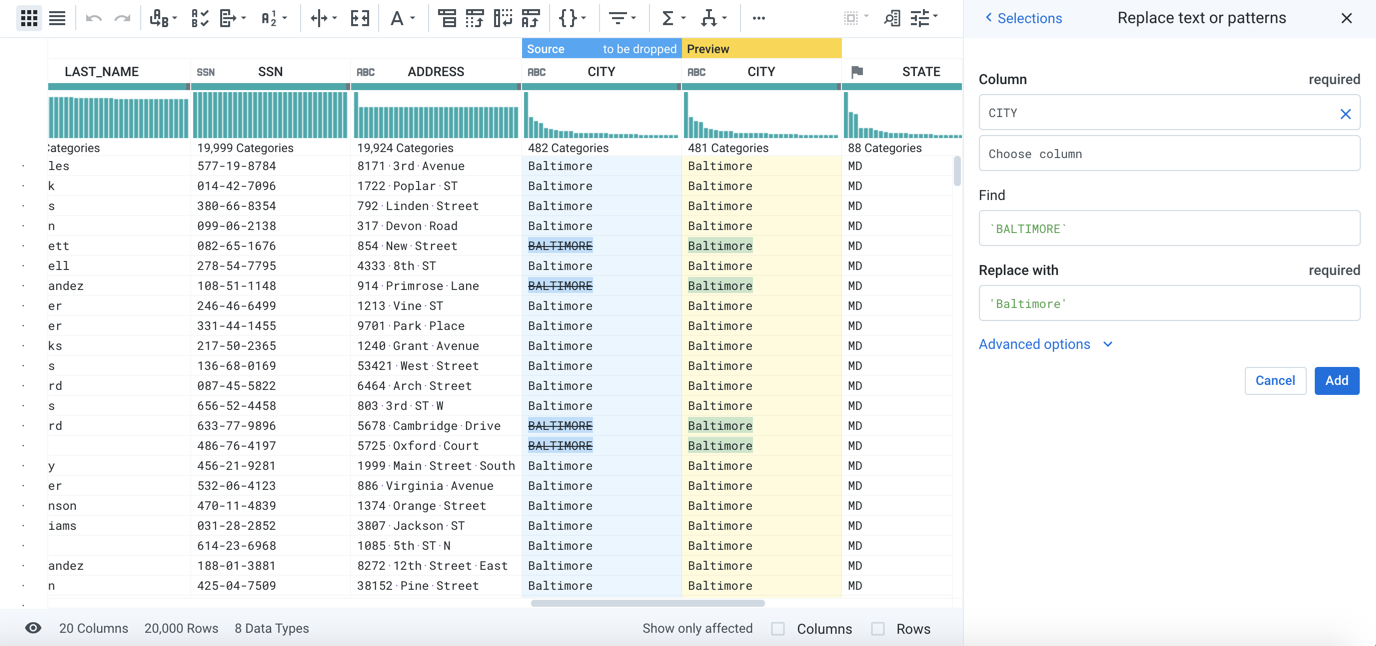
Figure: Modifying steps in the Transform Builder
In the Transform Builder, you can replace the pattern with the specific string to locate: BALTIMORE. The new value, which is currently blank, can be populated with the replacement value: Baltimore. ClickAdd.
The step is added to the recipe and automatically applied to the data sample displayed in the Transformer page. For more information, see Transform Builder.
See Cleanse Tasks.
Enrichment
Before you deliver your data to the target system, you might need to enhance or augment the dataset with new columns or values from other datasets.
Union datasets:
You can append a dataset of identical structure to your currently loaded one to expand the data volume. For example, you can string together daily log data to build weeks of log information. See Append Datasets.
Join datasets:
You can also join together two or more datasets based on a common set of values. For example, you are using raw sales data to build a sales commission dataset:
Your sales transaction dataset contains a column for the salesman's identifier, which indicates the employee who should receive the commission.
You might want to join your sales transaction dataset to the employee dataset, which provides information on the employee's name and commission rate by the internal identifier.
If there is no corresponding record in the employee dataset, a commission is not rewarded, and the sales transaction record should not be present in the commission dataset.
This commission dataset is created by performing an inner join between the sales transaction dataset and the employee dataset. In the Search panel, enter join. See Join Data.
Lookup values:
In some cases, you might need to include or replace values in your dataset with other columns from another dataset. For example, transactional data can reference product and customer by internal identifiers. You can create lookups into your master data set to retrieve user-friendly versions of customer and product IDs.
Note
The reference data that you are using for lookups must be loaded as a dataset into Designer Cloud Powered by Trifacta Enterprise Edition first.
To perform a lookup for a column of values, click the caret drop-down next to the column title and select Lookup.... See Lookup Wizard.
For a list of common workflows to enhance your dataset, see Enrichment Tasks.
Sampling
The data that you see in the Transformer page is a sample of your entire dataset.
If your dataset is small enough, the sample is the entire dataset.
For larger datasets, Designer Cloud Powered by Trifacta Enterprise Edition auto-generates an initial sample from the first rows of your dataset.
For larger datasets, you must learn how to generate new samples, which can provide different perspectives on your data and, in complex flows, enhance performance.
Tip
Sampling is an important concept in Designer Cloud Powered by Trifacta Enterprise Edition.
For more information, see Sampling Basics.
Profile
As part of the transformation process, you can generate and review visual profiles of individual columns and your entire dataset. These interactive profiles can be very helpful in identifying anomalies, outliers, and other issues with your data. For more information, see Profiling Basics.