Tipos de gráfico
En las siguientes imágenes se muestran los tipos de gráficos que la herramienta Gráficos puede configurar.
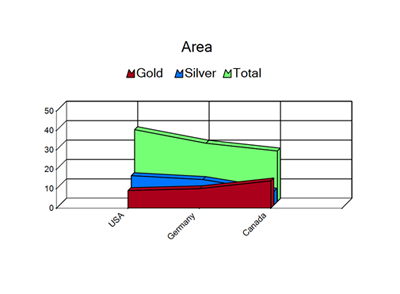
Área
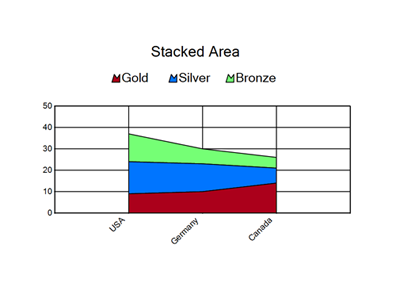
Área apilada
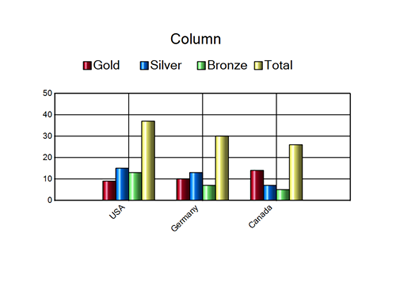
Columna
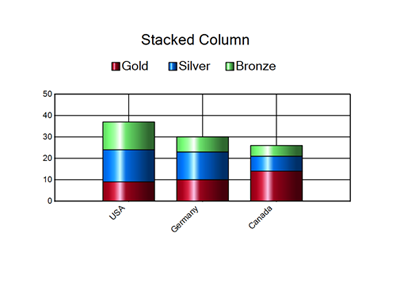
Columna apilada
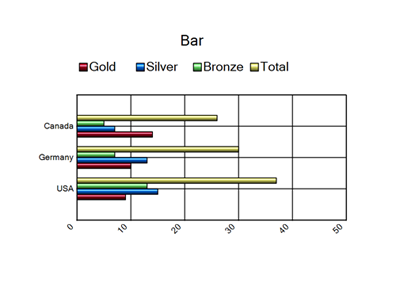
Barra
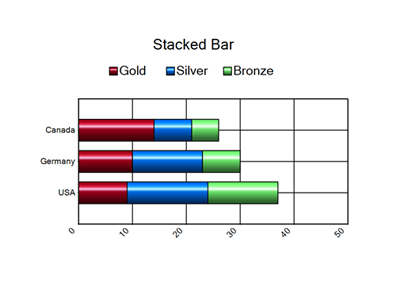
Barra apilada
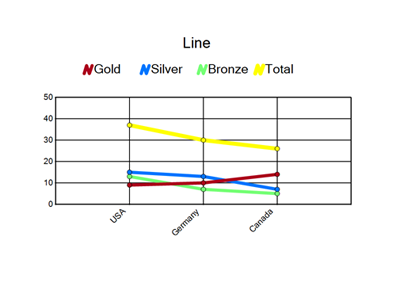
Línea
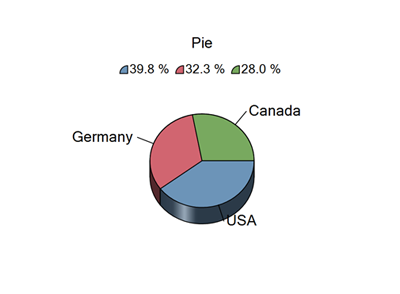
Circular
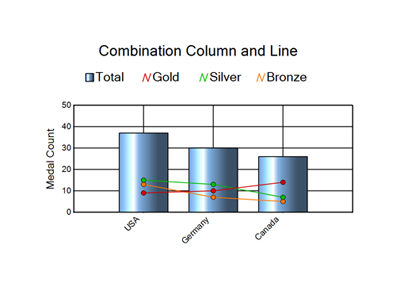
Combinación de columna y línea
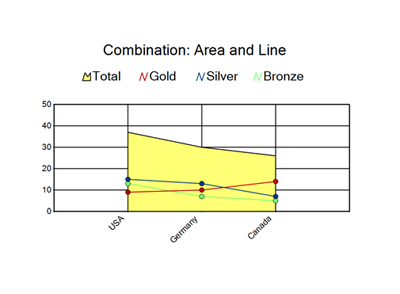
Combinación de área y línea
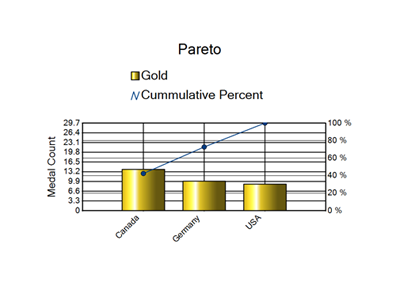
Pareto
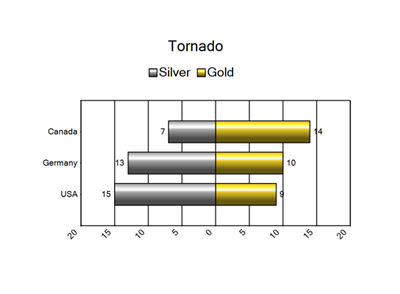
Tornado
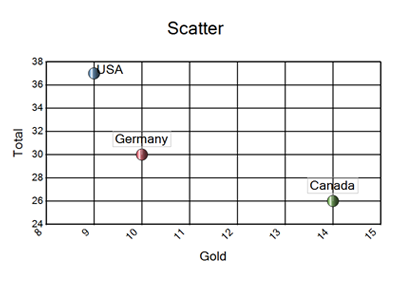
Dispersión
Burbuja
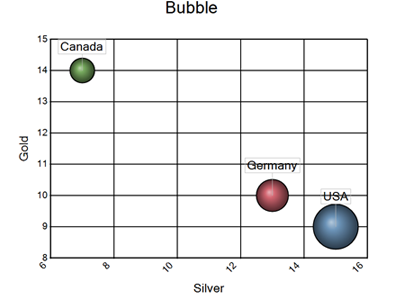
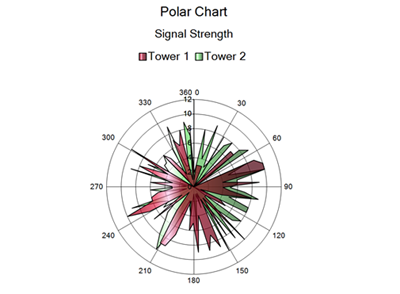
Gráfico polar
Radar
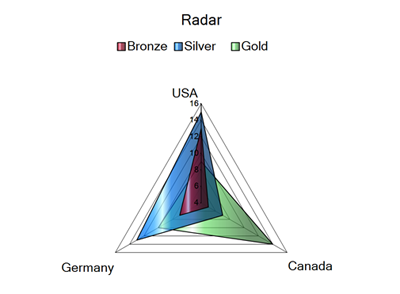
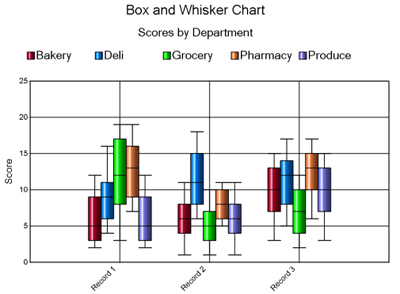
Gráfico de caja y bigote