Types de diagrammes
Les images suivantes montrent les types de diagrammes que l'outil Graphiques peut configurer.
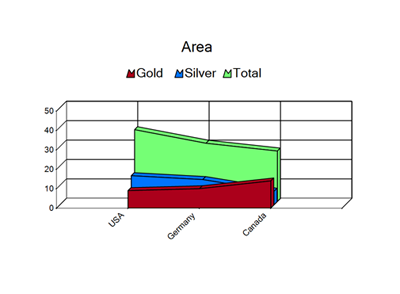
Zone
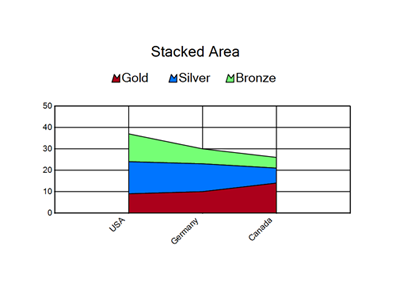
Zone empilée
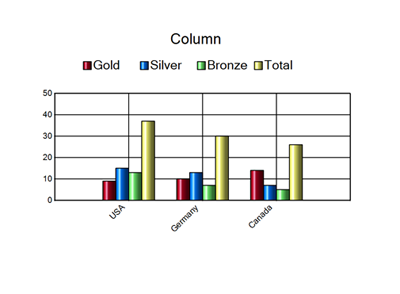
Colonne
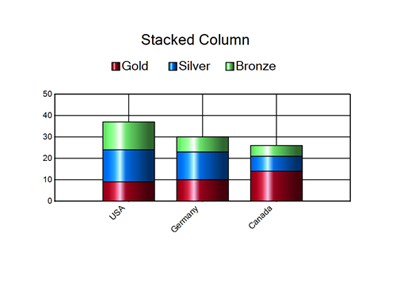
Colonne empilée
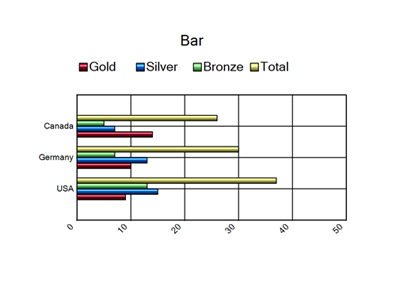
Barre
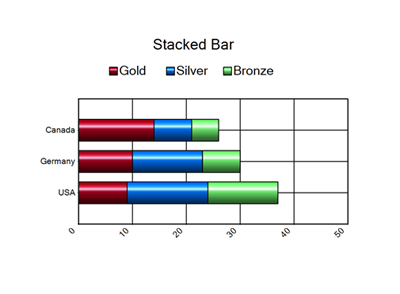
Barre empilée
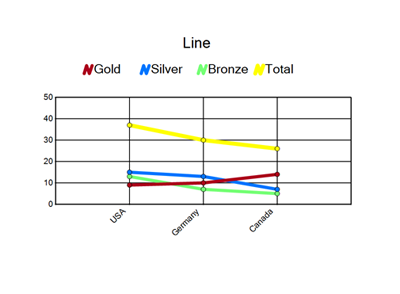
Ligne
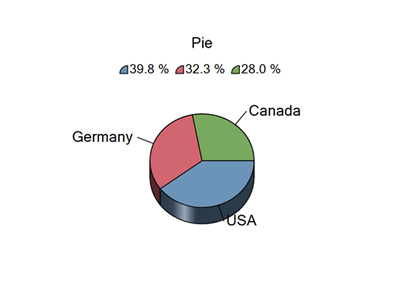
Camembert
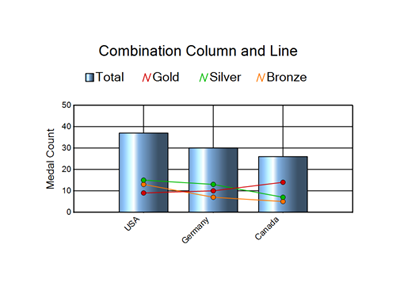
Combinaison : colonne et ligne
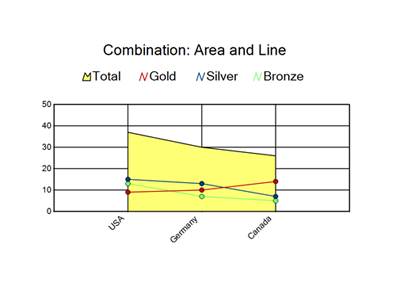
Combinaison : zone et ligne
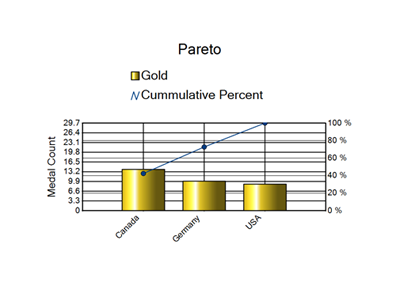
Pareto
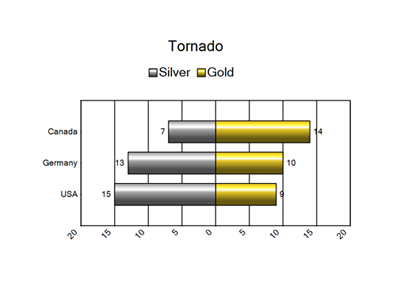
Tornado
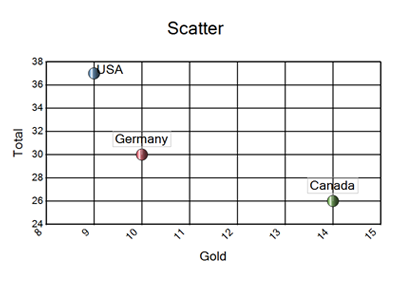
Nuage de points
Bulle
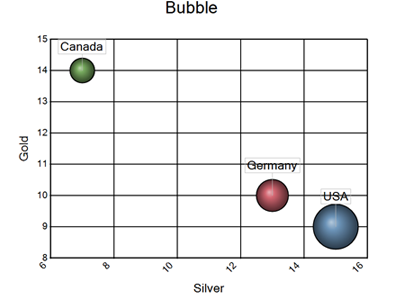
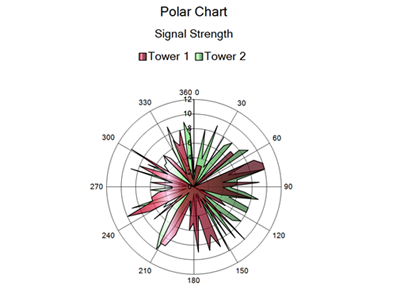
Diagramme polaire
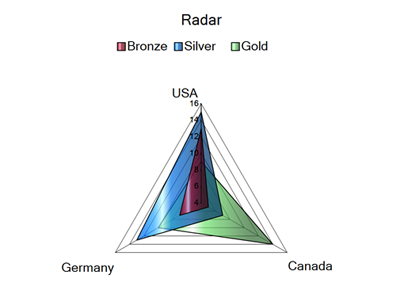
Radar
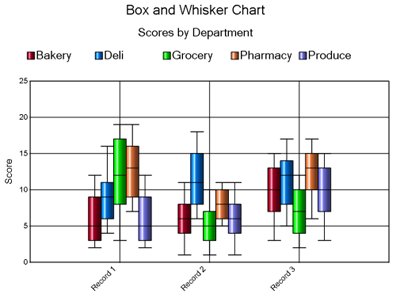
Graphique boîte à moustaches