Diagrammtypen
Die folgenden Bilder zeigen die Diagrammtypen, die das Diagrammerstellungs-Tool konfigurieren kann.
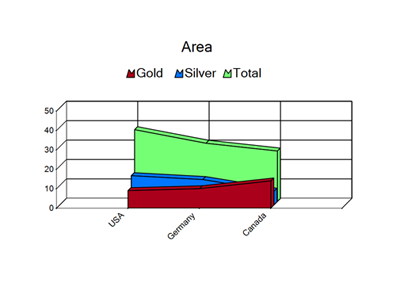
Fläche
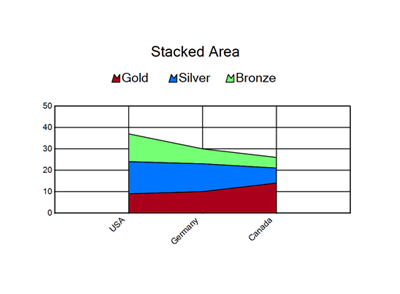
Gestapelter Bereich
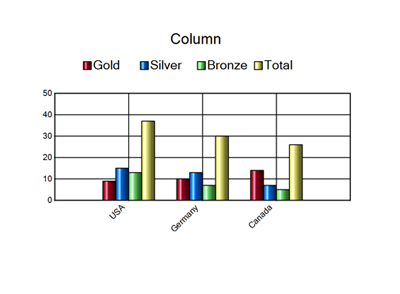
Spalte
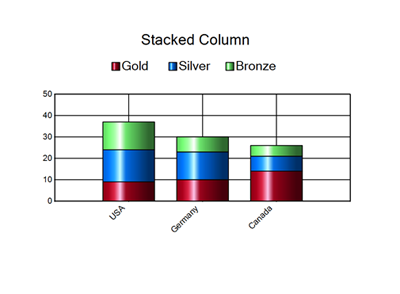
Gestapelte Säulen
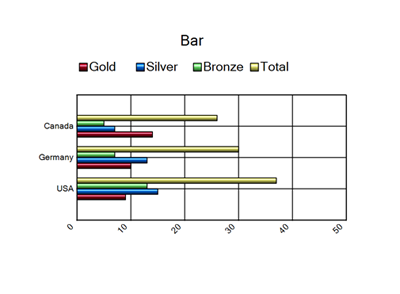
Balken
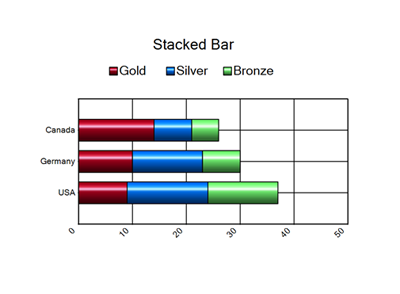
Gestapelter Balken
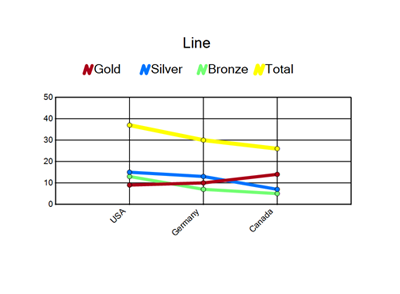
Linie
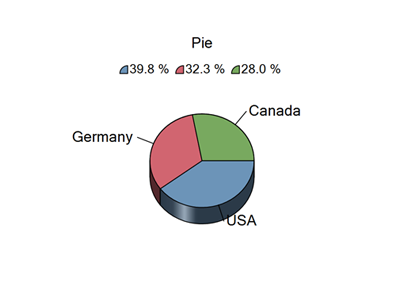
Kreis
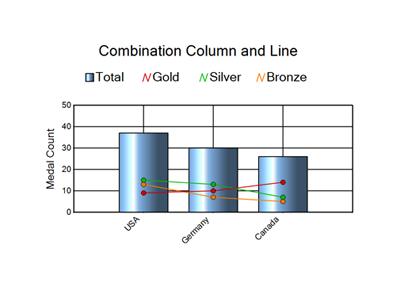
Kombination Spalte und Linie
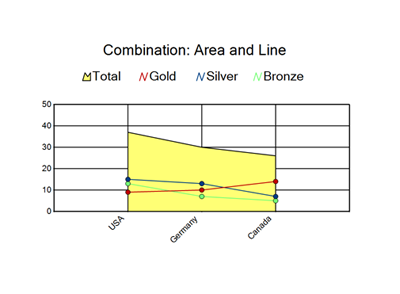
Kombination Bereich und Linie
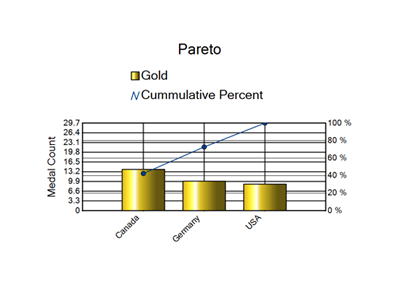
Pareto
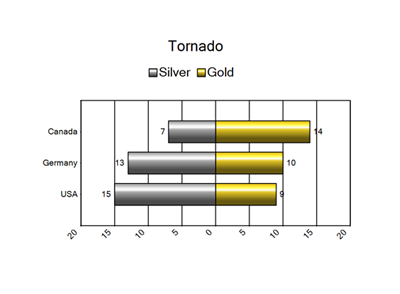
Tornado
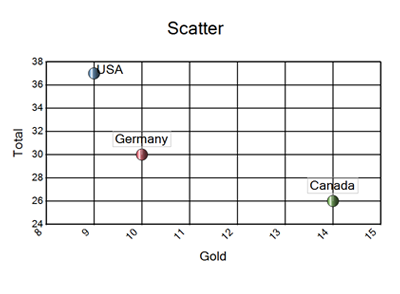
Streuung
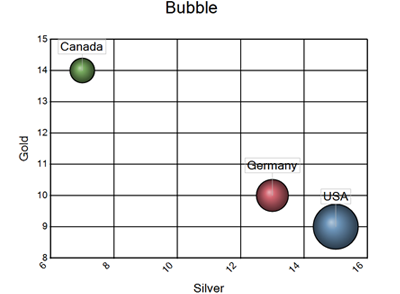
Blase
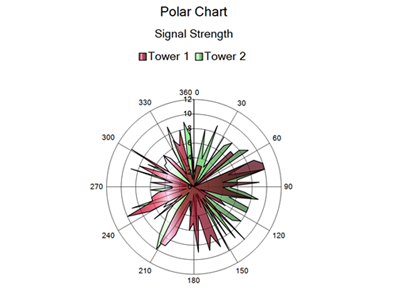
Polardiagramm
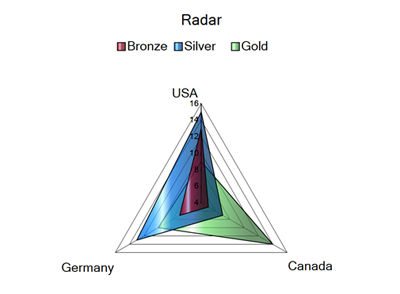
Radar
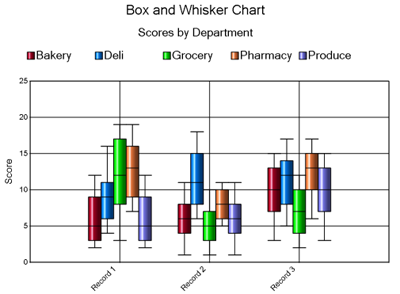
Kastendiagramm