Tipi di grafico
Le immagini seguenti mostrano i tipi di grafici che lo Strumento Grafici può configurare.
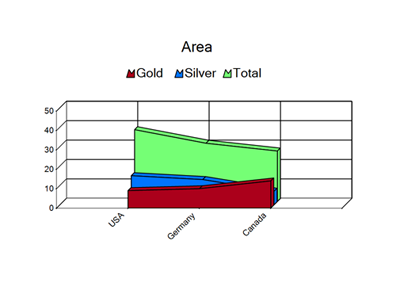
Area
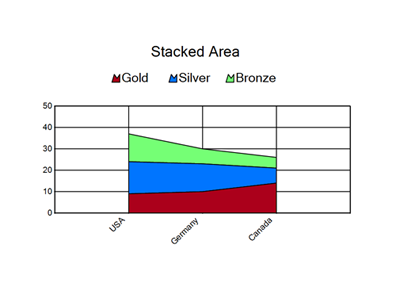
Area sovrapposta
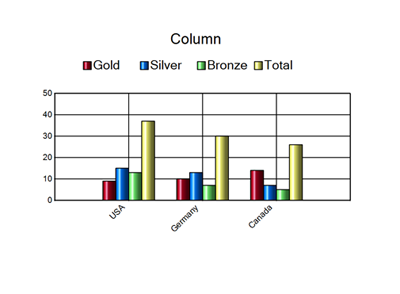
Colonna
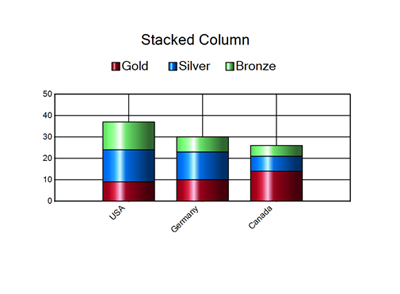
Colonna sovrapposta
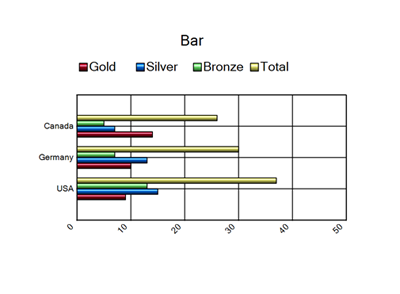
Barra
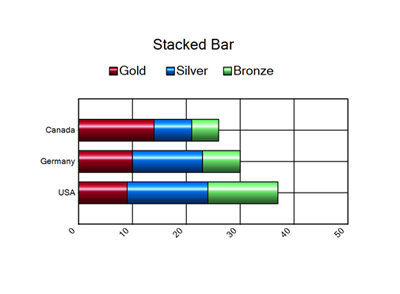
Barra sovrapposta
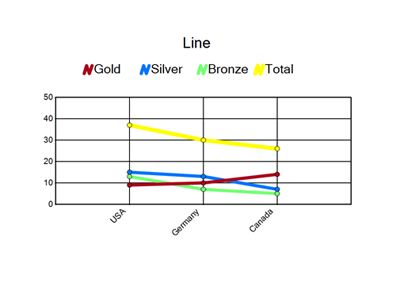
Riga
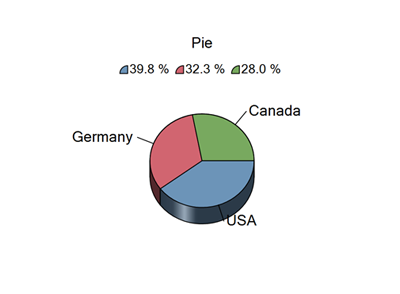
Torta
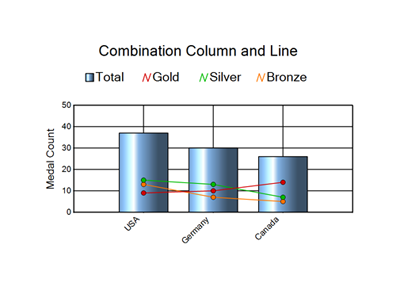
Combinazione Colonna e riga
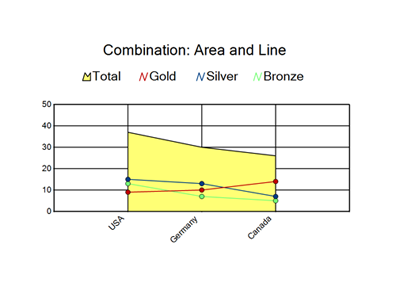
Combinazione Area e riga
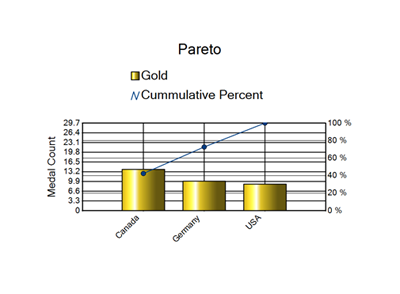
Pareto
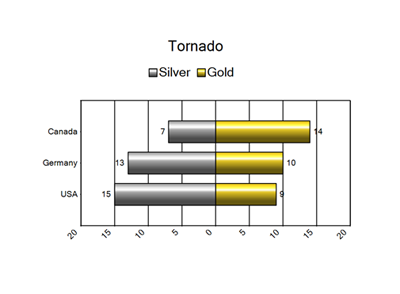
Tornado
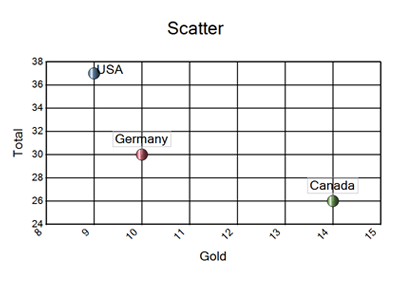
Dispersione
A bolle
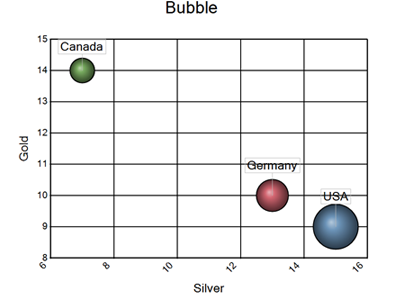
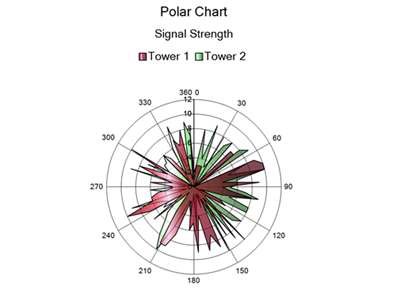
Grafico polare
Radar
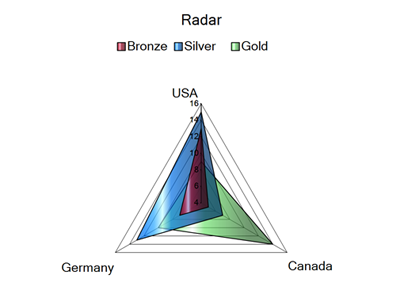
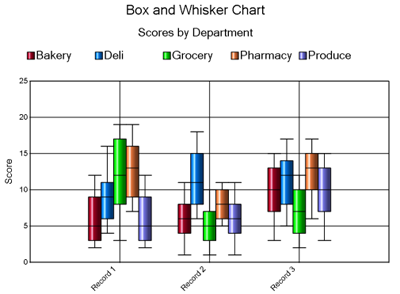
Grafico a scatola e baffi